- C/2024 G3 ATLAS
Despite unfavorable viewing circumstances, comet C/2024 G3 ATLAS gave a very nice display, likely the finest since comet McNaught in 2007. It was visible almost exclusively from the southern hemisphere. The comet underwent 2 main outbursts. The first outburst was about 2 magnitude that happened between January 2nd and 3rd and lasted for several days. A second outburst happened just after perihelion on January 15th and that probably lead to the subsequent disintegration of the comet that became obvious on January 19th. The simulation takes into account these outburst and disintegration of the comet by a time-varying absolute magnitude of the comet H0.
The comet gave a wonderful appearance in LASCO C3, with multiple tails/very strong striations as anticipated by the simulations. It was captured by several observers in daylight located about with telescope at about 5° solar elongation as it reached a maximum magnitude around -3.5 just after perihelion.
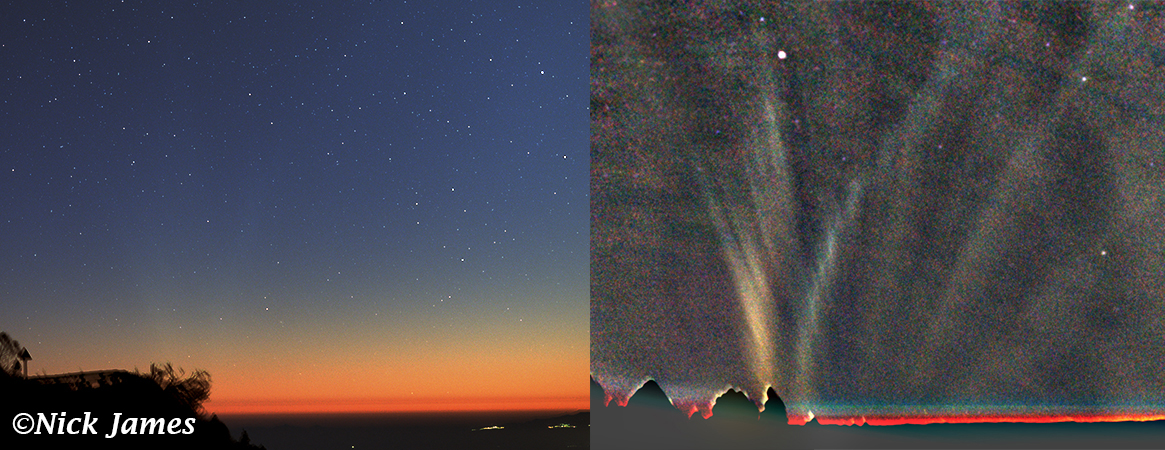
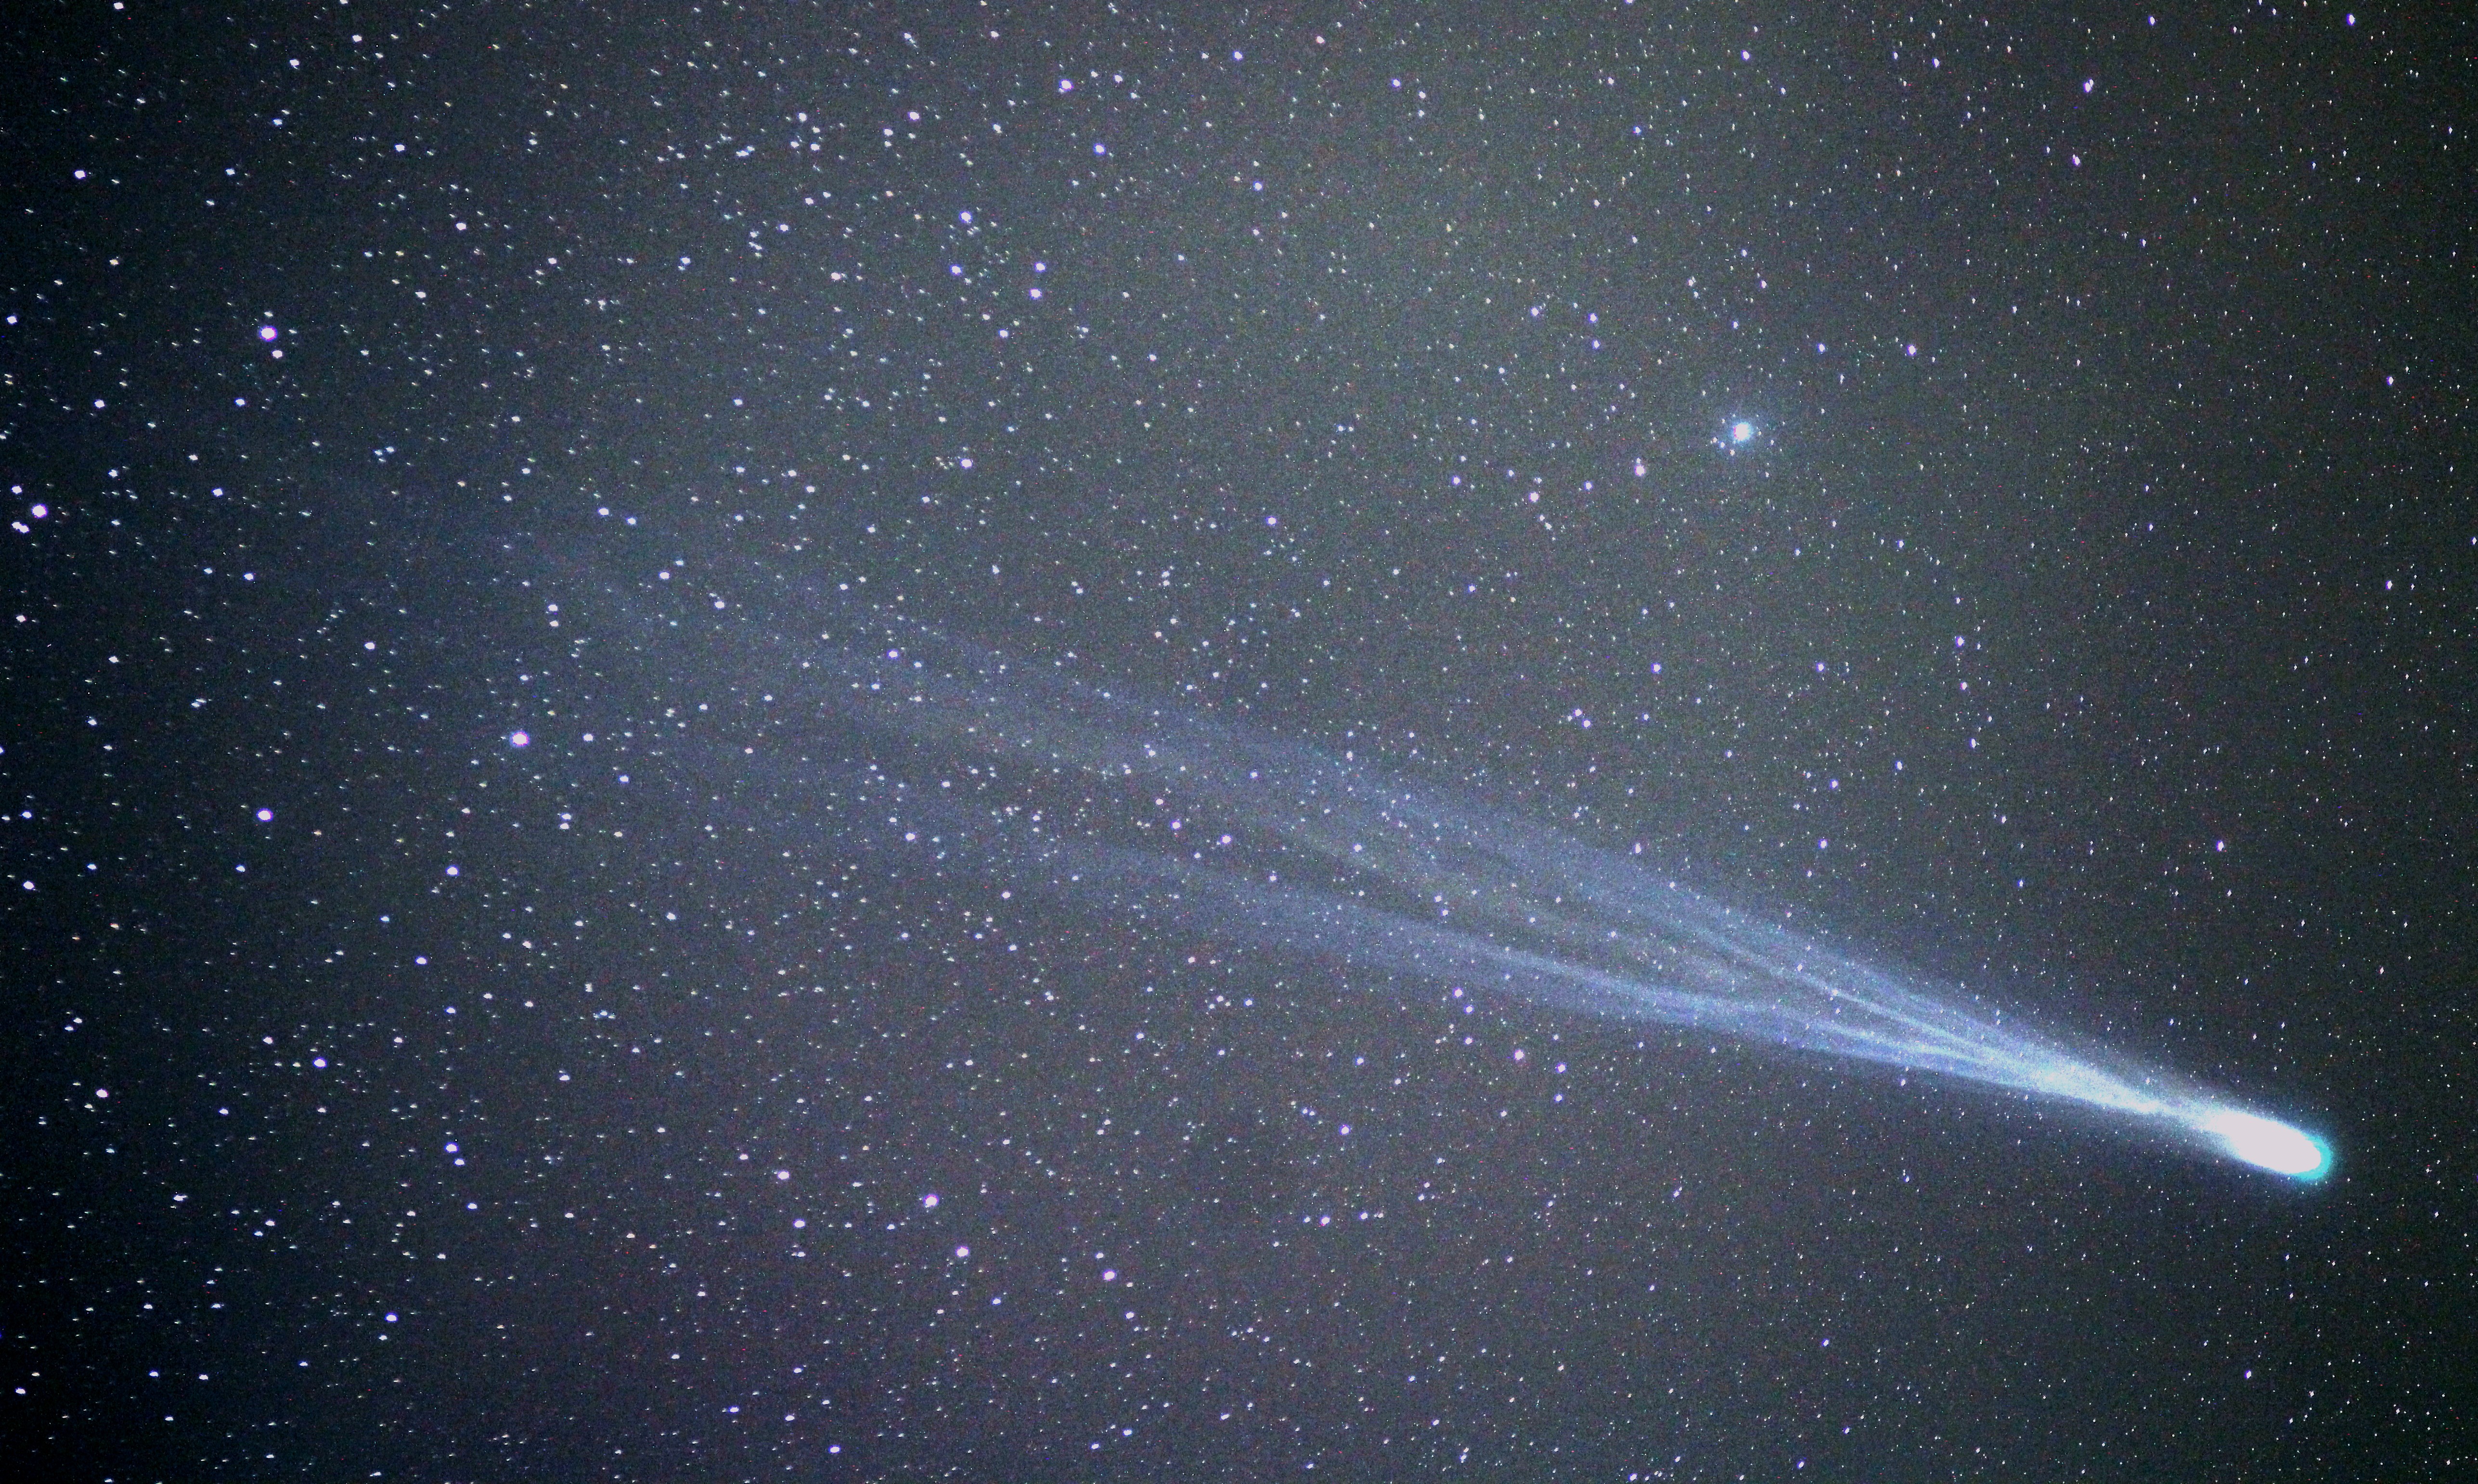
Simulations made before the comet apparition anticipated that the tail of the comet could be detected photographically from the Northern hemisphere between January 18th and 22nd a bit similarly as the tail of comet McNaught 18 years before, though much fainter. Indeed, Nick James travelled to Tenerife and was able to capture photographically the tail of the comet. In France, bad weather prevented me from trying to capture it too.
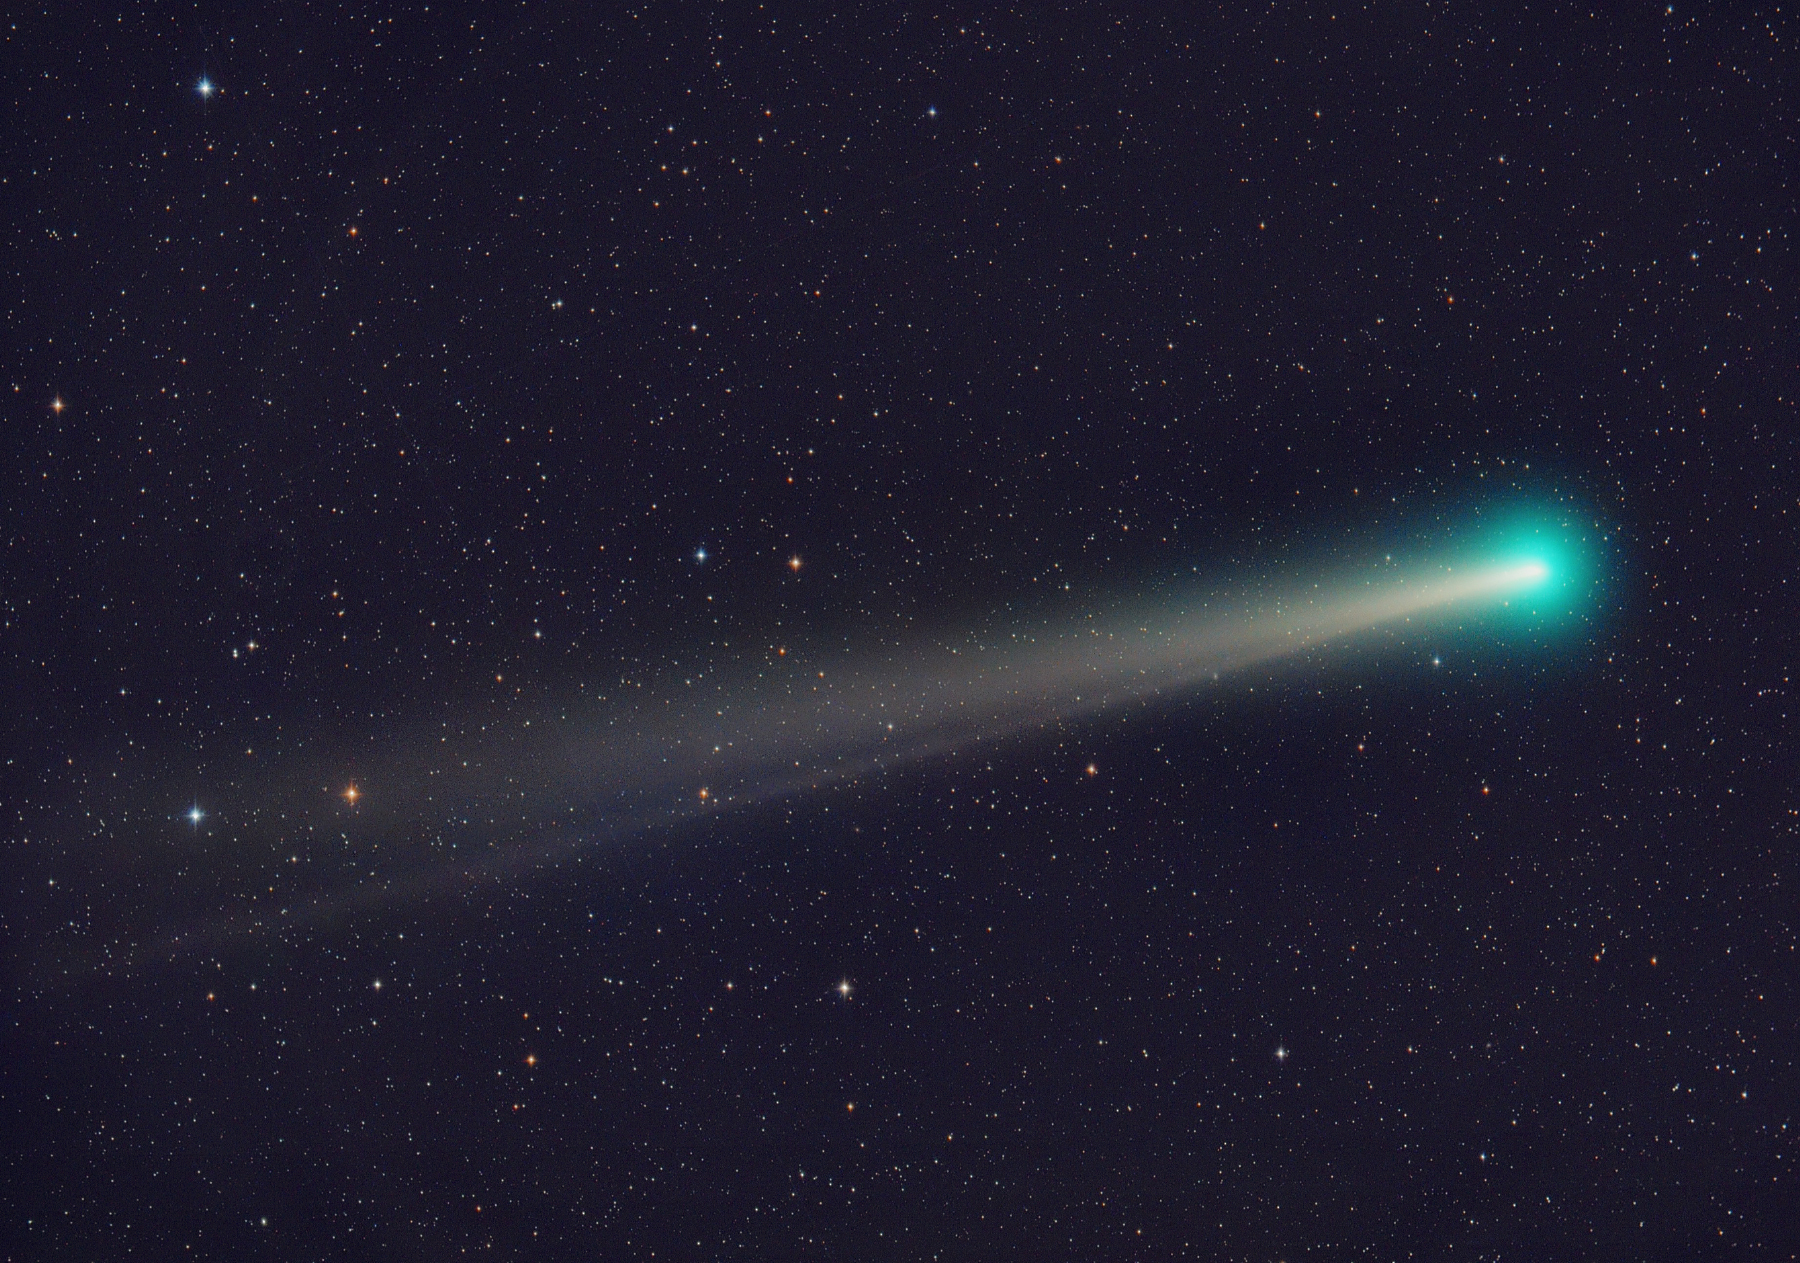
The best part of display was definitely from the southern hemisphere between January 19th and 26th, where a strongly striated dust tail measuring 15° to 20° was captured. During the period, the deepest images like the one of NOIRLab show that besides the main dust tail created by the dust emitted during perihelion, subsequent outburst and nucleus disintegration, some enhancement of the tail was visible, making a large angle with the main tail. The simulation shows that this enhancement was made by the large amount of dust released during the early January outburst, and in between the relatively darker area corresponds to a reduced dust emission between this outburst and perihelion.
The comet then evolved as a “headless comet” as the material from the disintegrated nucleus slowly dispersed.

- C/2023 A3 Tsuchinshan-ATLAS
The simulations helped anticipate the appearance of the comet, with a first highlight between Spetmber 28th and October 2nd, and another one between October 14th and 18th. The simulation correctly anticipated the appearance of the dust tail in the period between between October 2nd and October 6th, with the head of the comet below horizon. The appearance of the comet in SOHO LASCO C3 field of view, with the shape of the tail as well as the long lasting antitail visible in LASCO C3 until orbital plane crossing on October 14th.
The simulation below have been updated taking into account that the antitail appeared not to have been enhanced with foward scattering, while the initial simulations published at the time of the comet appearance had the antitail tail enhanced by forward scattering and thus significantly stronger than it actually was.

- C/2021 A1 Leonard
Comet C/2021 A1 Leonard was a very gaseous comet that reached magnitude 3 in December 2021. So it bears some similarity with comet C/2024 A6 Lemmon. Comet Leonard underwent an outburst of about 2.5 magnitudes on December 15th. After December 21st when the moon no longer interfered with the view, a very long gas tail was detected for about 10 days, reaching about 60°.
The simulations do not quite fit the behavior of comet Leonard. The main reason is that it seems that before outburst, the comet was less gaseous and did not exhibited a strong ion tail, while it became much more gaseous after the outburst. Such time-varying composition is not handled with the tail simulation program, so before the outburst, the gas tail visibility and length is overestimated. After the outburst and December 21st, this is quite the opposite as the simulation renders a maximum tail length around 40° decreasing to around 20° on December 29th while the gas tail was recorded to be the longest on December 29th at 60°. Although this can be attributed to daily variations of the tail length, globally the simulation still underestimates the maximum possible tail length after December 21st.
- C/2020 F3 NEOWISE
The simulations allow to identify the best time of the display, between July 11th and July 15th, as well as the shape and size of the comet dust tail with the presence of some striations, and the time when the gas tail was longest around 20th of July.
- C/2013 A1 Siding Spring (from Mars)
Small comet 2013 A1 Siding Spring had a record-breaking close encounter with Mars on October 19th 2014 at a distance of only 0.0007 AU. The simulation shows how fast the appearance of the comet must have been from Mars. The comet was brighter than magnitude 2 for only a bit more than 24hours, and the highlight of the apparition lasted no more than 6 hours!
According the simulation, at the time of the closest approach, the comet must have then appeared as an extremely large, mostly featureless cloud. The calculated magnitude is derived from the visual magnitude from Earth, so it represents the integrated magnitude of the whole cloud. So despite the very bright -5 magnitude calculated, it was probably not as impressive as the figure sounds. Despite the comet simulations having been optimized for Earth, the apparent size calculated seems similar to the NASA animation.

- C/2011 W3 Lovejoy: see the page dedicated to simulations of Kreutz comets
- C/2006 P1 McNaught
The simulations confirm how extraordinary comet McNaught was, and allows to identify correctly the highlight of the display between January 19th and January 25th. The main features are correctly simulated, with extensive but short-lived dust tail, with some parts visible from the northern hemisphere, and the strong striations present in the dust tail.
- C/2002 T7 LINEAR
Comet C/2002 T7 LINEAR was a very gaseous comet that reached magnitude 3 in May 2004. So, like comet C/2021 A1 Leonard, it bears some similarity with comet C/2024 A6 Lemmon. It was only visible from the southern hemisphere. The comet gas tail reached more than 40° on photographs, which was somehow unexpected. At this time, the digital photography was still in its infancy, and one could imagine that possibly longer tails length could be captured if the comet happened nowadays.
Indeed simulation show that the geometry was very favorable for having low contrast, long gas tail length between May 10th and May 25th. On the simulations, the tail reaches its maximum length (longer than 60°) between May 15th and May 20th.

- C/2002 V1 NEAT
Comet C/2002 V1 NEAT had a perihelion distance similar to comet C/2024 G3 ATLAS, but it only reached a magnitude between -1 and -2 at perihelion. The simulation indeed shows that it was not enough for making a significant tail.

